1St Bar GAP+BkOut Screener v2 by RMFirst Bar Gap and subsequent conditions are used as one of the several strategies for Day traders.
This script runs on first bar and checks if the stocks has an initial Gap (up or down), then checks for next bars to be inside the boundaries of the first candle
you can customize this screener according to your requirement. There are a number of very clever people I have taken bits of code and ideas, thanks to you all :)
Used part of this code as published by @PineCoders and Public Libraries. Also add some power query code to help you create the symbols input in the script
Disclaimer: This is not a Financial advisory tool. For education purposes only. * Use at your own risk *
Outline:
gap up/ gap down on 1 min first candle -> good
2nd candle inside 1st candle -> good
3rd to nth candle to break out from first candle range -> good /alert/ Plot flag
//M (Excel power query) code to load and format watchlist from txt file format
//Input: , Output:
let
// replace and for the correspondign values in your computer
Source = Csv.Document(File.Contents("C:\ \ "), ),
#"Transposed Table" = Table.Transpose(Source),
#"Sorted Rows" = Table.Sort(#"Transposed Table",{{"Column1", Order.Ascending}}),
#"Added Index" = Table.AddIndexColumn(#"Sorted Rows", "Index", 1, 1, Int64.Type),
#"Changed Type1" = Table.TransformColumnTypes(#"Added Index",{{"Index", type text}}),
#"Inserted Merged Column1" = Table.AddColumn(#"Changed Type1", "Merged", each Text.Combine({"0", }), type text),
#"Inserted First Characters" = Table.AddColumn(#"Inserted Merged Column1", "Two Characters", each Text.End( , 2), type text),
#"Removed Columns" = Table.RemoveColumns(#"Inserted First Characters",{"Index", "Merged"}),
#"Inserted Merged Column" = Table.AddColumn(#"Removed Columns", "Merged", each Text.Combine({"s", , " = input( '", , "' , type=input.string)"}), type text)
in
#"Inserted Merged Column"
//--> once input string is created Copy&Paste in this code after // Symbols _ Use Power Query in Excel
// end of M code to load watchlist from txt format
Cari dalam skrip untuk "the script"

Strategy TemplateTrying to include few basic things which is needed for strategy which can be used as template.
Few important components
Strategy parameters
Few important parameters include - initial_capital, default_qty_type, default_qty_value, commission_type, pyramiding and commission_value. All my strategies will have similar settings with initial captial set to 20000 to 100000. 100% of equity per trade with no pyramiding (set to 1) and minimal commission.
margin_long and margin_short can be used for leveraged trading. But, since we are not using pyramiding, it will make no effect.
Trade Limiting parameters
Two types of limiting is available in the scripts
Limiting trading direction : this is done through method strategy.risk.allow_entry_in and input parameter tradeDirection
Limiting trades to particular time window : This is achieved through adding start time and end time parameters of type input.time and check whether time is within this window
Custom Methods
customized security method to get higher timeframe data
customized moving average method to get moving average of any type
Custom Parameters
Moving average Type option list which I use quite often. Any strategy where there is need to use moving average, I try to scan through different moving average types and lengths to see which one is more appropriate for the given strategy. Hence, keeping this parameter in template to make it readily available when I start with new strategy
waitForCloseBeforeExit - this is used if trailing stop need to activated as soon as price hits the stop or only on close price. This is again something I switch quite often based on strategy. Hence, keeping this as part of the template.
Entry and Exit statements for long and short
These statements from line (57 to 62) can remain as is even with new strategy. Only thing to be set are variables - buyCondition, sellCondition, closeBuyCondition and closeSellCondition
Last but not the least
In pinescript, a long and short position cannot coexist in a strategy at any point of time. Any short positions created will automatically stop long positions and vice versa. Hence, it is important make short and long trades mutually exclusive. In this example, I have used 200 weekly moving average as trend bias. No short positions are taken when price is trading above 200 weekly moving average low/close and no long positions are taken when price is less than 200 weekly moving average high/close. Any rule built on top of this (In this case a simple supertrend rules) ensures that there are no conflicting signals and hence avoids confusing trades on the stratgy.

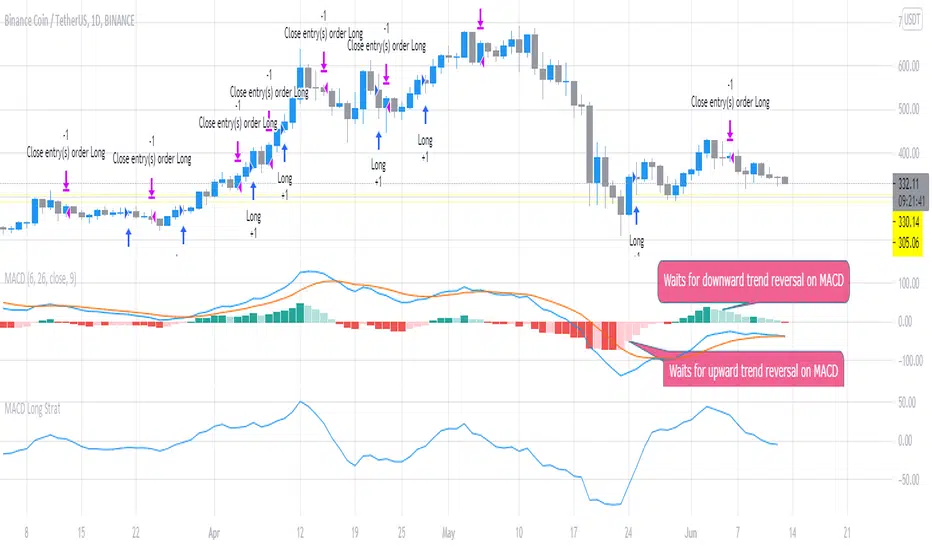
MACD Long StratFirst script I've written, but the concept is pretty simple. This uses the MACD with settings fast_SMA = 6 and slow SMA=16 and uses the distance between the 2 (histogram) to look for potential trend reversals to flag potential entries for Long trades. It waits for the confirmation looking backward 2 x timeframes (to reduce false calls slightly). You can adjust it to open / close quicker (1 timeframe instread of 2) but backtesting shows 2 timeframe delay is best to avoid false signals.
The script suggests Long entry points based on this criteria and uses the converse (reducing histogram / SMA difference delayed by 2 timeframes) to suggest exit or trade close points for downward reversal. It was originally written looking at 1m scalps but backtesting shows this is even more effective on higher timeframes (1D).
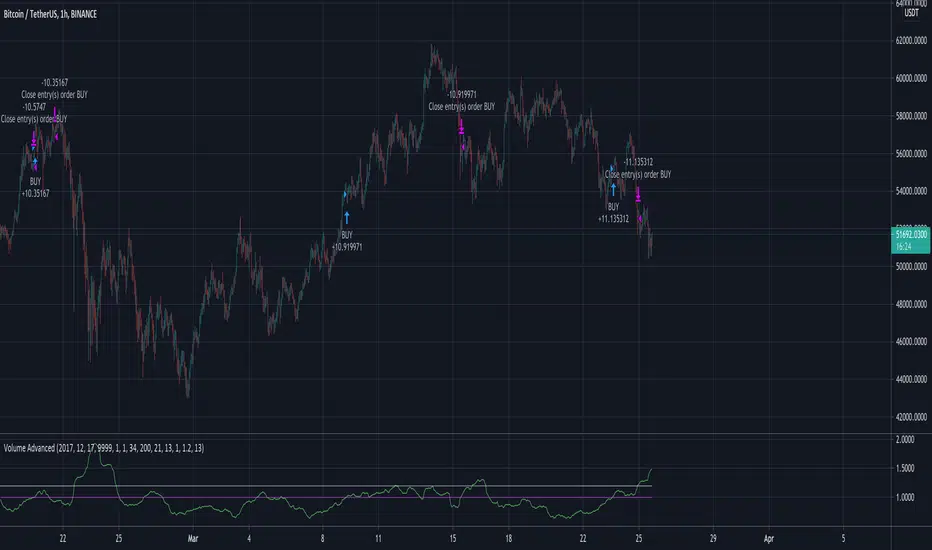
Volume AdvancedI have found out this script some time ago. In fact it is not my code (just have modified a little) and I don't know the author (couldn't find). So now I would like to share with the community, maybe somebody would have some idea how to make it better. The script itself is modified volatility oscillator (like ATR) based on volume, making a deal at the moment of price change. To recognize the current trend I have add simple function just to compare the current price with the N bars before, because sometimes in moments of high volatility there may be wrong signals.
Oscillator Evaluator (Analysis tool)Oscillator Evaluator (Analysis tool)
The oscillator evaluator is a tool that will help you analyse and compare the oscillator of your choice to another 2 oscillators.
By selecting the strategy with which you will analyze the oscillators, you will be able to see the behaviour of the oscillators in different aspects.
First there is a moving average increase or decrease strategy, that will give you a good idea of the correlation of the oscillator with the price.
The second is a commom 2 MA crossover strategy, that will give you and idea of the validaty of that oscillator as a strategy or as a trend filter.
The third strategy is a cross over 0 signal, that will go long on a crossover of 0 and short on a crossunder 0. This helps you see how good is the oscillator at evaluating suport and resistance areas and give you an idea of its balance.
The forth strategy is a Buy/Sell on extremes of the oscillator and will let you know how good is your strategy at spotting good places to buy and sell.
The fith strategy is to evaluate how goood the oscillator is as a mean reversion filter or how good it is at spotting small price changes.
The sixth strategy is similar to the last but is focused on how good is the oscillator spotting good places to take profits on trending strategies.
The 6 strategies in the script produce signals from the oscillator and from the oscillator only.
In conclusion this tool can be used to measure your oscillator and see if it really is as good as you think in comparison to others.
This script is not intended to be used as a full strategy but as a tool.

[DS]Entry_Exit_TRADE.V01-StrategyThe proposal of this script is to show the possible trading points of BUY and SELL based on the 15-minute chart of the Nasdaq Future Index. The start point of the strategy was schedule for 2021/01/01 and until the time of this publication (2021/01/31), for 1 index contract the results presented area a Gross Profit of 2.97% with a Net Profit of 1.35%.
█ FEATURES
The indicator shows on the graph the position of the MACD and TSI indicators that are the places of strength among Buyers and Sellers.
It's possible to observe a sharp fall or rise in the price of these positions.
On the current candle, a label is displayed containing the value of the William %R Mod indicator, which will display the OverBought position (dark red) and OverSold position (dark green). The other colors like light red and green are the regions where the price makes the decision of which direction to go.
There are also other indicators:
a) The positions of the BUY (light green) and SELL areas (light red);
b) The label with the position of BUY (dark green) and SELL (dark red) with the line that connects these points;
c) DEMA 72 (orange);
d) EmaOchl4 in the color green for BULL and red for BEAR market;
e) Pivots high and low
f) Maximum (purple light) and minimum areas (blue light)
█ FUNCTIONS AND SETTINGS
The indicator uses the following functions:
(1) DEMA - Double Exponential Moving Average (08,17,34, 72)
(2) ema () - Exponential Moving Averge (72, ohlc4)
(3) plot()
(4) barcolor()
(5) cross()
(6) pivots ()
(7) William R% Md (OverBought = -7, OverSold=-93)
(8) Maximum and Minimum Value
(9) fill()
(10) macd () - Moving Average Convergence Divergence (Fast Lengt=12, Slow Length=26, Source=close, Signal Smoothing=9)
(11) tsi() - Trading Strenght Indicator==> Índice de Força Real ( IFR ) (Long Length=72, Short Length=17, Signal Length=17)
(12) Buy and Sell TRADE Points
█ PERFORMANCE AND ERRORS
The positions of BUY and SELL points are defined through the crossing of the Dema 34 candles with the Ema Ohcl4. As it is an indicator, it can present different positions from de market direction. Thus there is a need to observe the direction of the market in order to verify whether the indicate decision is really acceptable. The decision to BUY or SELL an asset must be well studied to avoid financial losses. The indicator will only help you in this decision, is your responsibility the decision of entering or leaving an asset.
█ THANKS TO
PineCoders for all they do, all the tools and help they provide, and their involvement in making a better community. All the PineCoders, Pine Pros, and Pine Wizards, people who share their work and knowledge for the sake of it and helping others, I'm very happy and grate full indeed.
█ NOTE
If you have any suggestions for improving the script or need help using it, please send a message in the comments

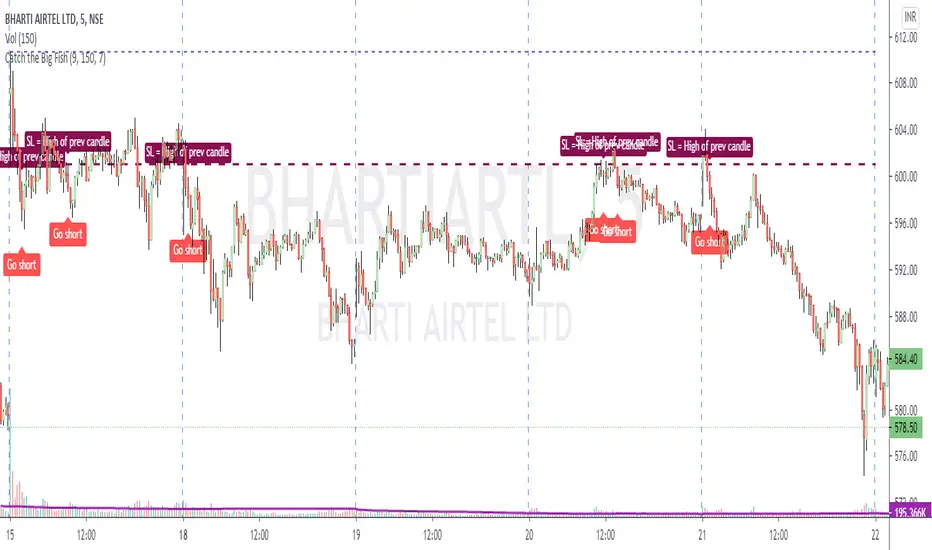
Catch the Big FishVolume based script to catch a big move. Works best on 5 min timeframe.
The default sma duration for volume is set to 150 = number of candles in 5 mins timeframe for 2 days.
Heavy volume is defined as = more than 9 times of sma.
Both parameters are configurable.
Trading strategy: Long buy at high / Short sell at low of the candle where the script gives the signal.
Important note regarding SL - for Long / Short positions respectively, the SL should be placed at low / high of previous candle, and NOT of the same candle.
QuantNomad - Heikin-Ashi PSAR StrategyContinue experimenting with different combinations of strategies.
Here is the PSAR Strategy calculated based on HA candles. HA is already calculated inside the script, do not apply it to HA candles.
Strategy is calculated based on 25% equity invested with 0.1% commission.
####################
Disclaimer
Please remember that past performance may not be indicative of future results.
Due to various factors, including changing market conditions, the strategy may no longer perform as good as in historical backtesting.
This post and the script don’t provide any financial advice.

Channel Break [for free bot]I present to you a script for testing the channel breakout strategy for the Bitmex exchange.
Cryptocurrency itself is a trending tool, which is why breakout strategies generate the largest profits, and the channel breakout strategy is one of the most effective trend strategies.
The optimization result shows the result of trading on a volume of 20% of the deposit. But since Bitmex trades in futures contracts, you can use 50%, 100% and even much more, depending on your attitude to risk.
At the time of publication on the Bitmex exchange there are 12 different contracts, i.e. You can diversify your trading well (by pre-optimizing the settings for each contract).
In the script, you can set up many trading options - timeframe, periods for buying and selling, method of exiting a trade, stop loss, take profit, risk management, etc.
Thus, you create a strategy "for yourself".
Представляю Вам скрипт для тестирования стратегии пробоя канала для биржи Битмекс.
Криптовалюта, сама по себе является трендовым инструментом, именно поэтому, пробойные стратегии генерируют самую большую прибыль, а стратегия пробоя канала – является одной из самых эффективных трендовых стратегий.
На результате оптимизации показан результат торговли на объеме в 20% от депозита. Но так как на Битмекс торговля идет фьючерсными контрактами, Вы можете использовать 50%, 100% и даже намного больше, в зависимости от Вашего отношения к риску.
На момент публикации на бирже Битмекс есть 12 разных контрактов, т.е. Вы можете хороши диверсифицировать свою торговлю (предварительно оптимизируя настройки по каждый контракт).
В скрипте Вы можете настроить множество вариантов торговли - таймфрейм, периоды для покупки и продажи, метод выхода из сделки, стоп-лосс, тейк-профит, рискменеджмент и т.п.
Таким образом Вы создаете стратегию "под себя".

Custom Screener with Alerts [QuantNomad]Some time ago I published an example of simple custom screener in PineScript:
The only thing this screener did is created a dynamic label with screener output.
Recently TradingView announced alerts from the strategy with the possibility to add custom messages to alerts.
So using it I was able to create a bit more advanced screener which sends results as alert messages. With tools like Alertatron, you can easily redirect them to Telegram if you want.
It works for 40 symbols (limitation of the number of security calls).
To create your own screener you need to change only screenerFunc. The logic of this function is very simple, it outputs value you want to display in screener and condition based on which your screener should filter your stocks.
To create alerts for this screener create an alert from strategy and use {{strategy.order.alert_message}} as alert message.
Do you know now how to make this screener better? Let me know.
Disclaimer
Please remember that past performance may not be indicative of future results.
Due to various factors, including changing market conditions, the strategy may no longer perform as good as in historical backtesting.
This post and the script don’t provide any financial advice.

Best Supertrend CCI StrategyHello traders
Someone requested the strategy version of the Supertrend CCI indicator
It's a Supertrend not based on candle close but based on a CCI ( Commodity Channel Index )
How does it work?
Bull event: CCI crossing over the 0 line
Bear event: CCI crossing below the 0 line
When the event is triggered, the script will plot the Supertrend as follow
UP Trend = High + ATR * Factor
DOWN Trend = Low - ATR * Factor
This is an alternative of the classical Supertrend based on candle close being above/beyond the previous Supertrend level.
Hope you'll enjoy it and it will improve your trading making you a better trader
Dave

SuPeR-RePaNoCHa #2TP#This is the last of the 'RePaNoCHa' script for Automatic Trading ;-) ... This time with two take profits ...
It Use 6 indicators + volume:
-JURIK MOVING AVERAGE
-RANGE FILTER
-ADX
-PARABOLIC SAR
-RSI + VOLUME WEIGHTED
-MACD
-VOLUME
To close the position you can choose between 2 Take Profit and the amount to use on each one.
You can transform it yourself into 'study' mode to get alerts.
Take Profits can be generated from the same entry, (syntax example on the script) so the fees will be lower (0.04 + 0.02 / 2 = 0.03).
Settings for BINANCE FUTURES BTC:USDT
Enjoy...

VIX - SHORT - SVXY - Daily Chart (Oldinvestor)This looks at he VIX and trades SVXY. Load SVXY and run the script on SVXY.
INPUTS:
Entry - You set this number to how high you want the VIX to go before SVXY will be bought. Keep in mind it buys the bar after a trigger, results may be confusing
Exit - You set this number to how low you want the VIX to go before SVXY will be sold.
Year - This as stated, It will start trading on the year you set here.
Good luck.
This script is for learning purposes, and boy did I learn something. UVXY still sucks

Candle Patterns Strategy V1//Modify DanyChe script to work in latest version of pinescript
//The script allows you to test popular candlestick patterns on various instruments and timeframes. In addition, you can configure risk management (if the value is zero, it means the function is disabled), and you can also specify the time of the trading session (for example, so that the positions are not transferred to the next day).
//The author is grateful to JayRogers and Phi35, their code examples helped a lot in writing the strategy.

Kijun-Sen Strategy [DasanC]This strategy employs the Kijun-Sen line (from Ichimoku cloud) as a baseline for decisions.
In essence, the Kijun-Sen is a kind of moving average based on the High/Low range, similar to Donchian channels.
We wait for a crossover or crossunder to enter a new trade, then exit upon the next cross.
It works on 1H timeframe and above. It also works for all the Major FX pairs (at least from my tests).
I use the ATR and a multiplier to decide the S/L position as well as the volume of the trade.
I also use an equity protector to close out of all trades if a specific DD % level is reached. In theory, this should never happen with only one trade open at a time, however, if a user wants to modify the script to pyramid orders then the equity protector could potentially "save" an account.
The default settings should produce winning results on Major pairs. You can change the backtest time in the script by altering line #53:
>if(time > timestamp(2017,1,1,0,0) and time < timestamp(2019,1,1,0,0))
TODO:
Add 2 additional forms of confirmation
Add volume to filter losing trades
Add exit indicator

Vortex Ocillator - backtestingbacktesting strategy for the vortex oscilator indicator, slightly modified on this version so that the buy and sell signals work with the backtesting and are consistant
original idea i posted by accident
the script with alerts
not intended to be financial advice, strategy is for made for testing
Biffy

VWMA + SMA BBollinger + RSI Strategy (ChartArt) mod by BiO618This is a script I remade from the original ChartArt's "CA_RSI_Bolling_Strat".
I added a VWMA following the SMA basis curve.
BBand was made with the SMA curve, +2DS.
The point of adding VWMA to the script is to get a fast correlation between price change and volume change.
How to interpret it:
Since 3-Intervals-VWMA = (P1*V1 + P2*V2 + P3*V3) / (V1+V2+V3)
As the volume grows, VWMA get smaller.
If the price goes to the upper band, and the VWMA follows it, Price grew more than Volume, and a correction would happen soon.
If the price goes to the lower band, and the VWMA follows it, Price dipped with a lot of Volume, and a continuation of trend would be expected.
If the price goes to the upper band, and the VWMA stays close to SMA, Price grew with a correspondient Volume, and the continuation of trend would be expected.
If the price goes to the lower band, and the VWMA stays close to SMA, Price dipped with low Volume, a correction would happen soon.
Remember that NO INDICATOR is flawless, support your interpretation with other indicators like RSI and MACD.
Hope you enjoy it!
φ!

[Autoview][BackTest] Blank R0.13BThis is a fork of JustUncleL's
Dual MA Ribbons R0.13
It is now a blank template for making new strategies / alerts for autoview
The changes are as follows:
Removed actual algo
Establish functions for long Signal, long Close Signal and short Signal, short Close Signal to minimize the places code must be edited to update / replace algos
Make allow Long and allow short and invert trade directions independent options
Added support for alternate candle types
Added autoset backtest period feature, and optional coloring
Moved strategy calls in to functions so they can all be commented out or activated / disabled in a single block at the top of the script
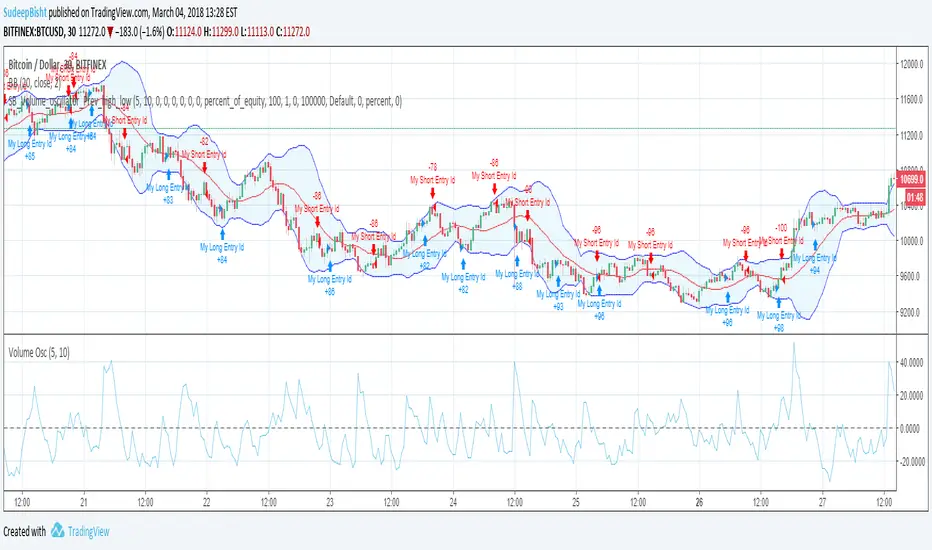
SB_Volume_oscillator_Prev_high_lowThe strategy is a take on traditional volume oscillator.
In Layman terms:
The script places an order when the oscillator crosses the zero mark in the volume oscillator.
If the previous high is greater than the absolute value of previous low then a long order is placed
And if the absolute previous low is greater than the previous high then a shrt order is placed.
Last script (bandwidth focus on other monetary works. If you have any opportunities ping me)
Message if you think of any modifications/ enhancements/ any opportunities. :)
Donations/Tips... :) -
BTC: 1BjswGcRR6c23pka7qh5t5k56j46cuyyy2
ETH: 0x64fed71c9d6c931639c7ba4671aeb6b05e6b3781
LTC: LKT2ykQ8QSzzfTDB6Tnsf12xwYPjgq95h4
XPloRR MA-Trailing-Stop StrategyXPloRR MA-Trailing-Stop Strategy
Long term MA-Trailing-Stop strategy with Adjustable Signal Strength to beat Buy&Hold strategy
None of the strategies that I tested can beat the long term Buy&Hold strategy. That's the reason why I wrote this strategy.
Purpose: beat Buy&Hold strategy with around 10 trades. 100% capitalize sold trade into new trade.
My buy strategy is triggered by the fast buy EMA (blue) crossing over the slow buy SMA curve (orange) and the fast buy EMA has a certain up strength.
My sell strategy is triggered by either one of these conditions:
the EMA(6) of the close value is crossing under the trailing stop value (green) or
the fast sell EMA (navy) is crossing under the slow sell SMA curve (red) and the fast sell EMA has a certain down strength.
The trailing stop value (green) is set to a multiple of the ATR(15) value.
ATR(15) is the SMA(15) value of the difference between the high and low values.
The scripts shows a lot of graphical information:
The close value is shown in light-green. When the close value is lower then the buy value, the close value is shown in light-red. This way it is possible to evaluate the virtual losses during the trade.
the trailing stop value is shown in dark-green. When the sell value is lower then the buy value, the last color of the trade will be red (best viewed when zoomed)(in the example, there are 2 trades that end in gain and 2 in loss (red line at end))
the EMA and SMA values for both buy and sell signals are shown as a line
the buy and sell(close) signals are labeled in blue
How to use this strategy?
Every stock has it's own "DNA", so first thing to do is tune the right parameters to get the best strategy values voor EMA , SMA, Strength for both buy and sell and the Trailing Stop (#ATR).
Look in the strategy tester overview to optimize the values Percent Profitable and Net Profit (using the strategy settings icon, you can increase/decrease the parameters)
Then keep using these parameters for future buy/sell signals only for that particular stock.
Do the same for other stocks.
Important : optimizing these parameters is no guarantee for future winning trades!
Here are the parameters:
Fast EMA Buy: buy trigger when Fast EMA Buy crosses over the Slow SMA Buy value (use values between 10-20)
Slow SMA Buy: buy trigger when Fast EMA Buy crosses over the Slow SMA Buy value (use values between 30-100)
Minimum Buy Strength: minimum upward trend value of the Fast SMA Buy value (directional coefficient)(use values between 0-120)
Fast EMA Sell: sell trigger when Fast EMA Sell crosses under the Slow SMA Sell value (use values between 10-20)
Slow SMA Sell: sell trigger when Fast EMA Sell crosses under the Slow SMA Sell value (use values between 30-100)
Minimum Sell Strength: minimum downward trend value of the Fast SMA Sell value (directional coefficient)(use values between 0-120)
Trailing Stop (#ATR): the trailing stop value as a multiple of the ATR(15) value (use values between 2-20)
Example parameters for different stocks (Start capital: 1000, Order=100% of equity, Period 1/1/2005 to now) compared to the Buy&Hold Strategy(=do nothing):
BEKB(Bekaert): EMA-Buy=12, SMA-Buy=44, Strength-Buy=65, EMA-Sell=12, SMA-Sell=55, Strength-Sell=120, Stop#ATR=20
NetProfit: 996%, #Trades: 6, %Profitable: 83%, Buy&HoldProfit: 78%
BAR(Barco): EMA-Buy=16, SMA-Buy=80, Strength-Buy=44, EMA-Sell=12, SMA-Sell=45, Strength-Sell=82, Stop#ATR=9
NetProfit: 385%, #Trades: 7, %Profitable: 71%, Buy&HoldProfit: 55%
AAPL(Apple): EMA-Buy=12, SMA-Buy=45, Strength-Buy=40, EMA-Sell=19, SMA-Sell=45, Strength-Sell=106, Stop#ATR=8
NetProfit: 6900%, #Trades: 7, %Profitable: 71%, Buy&HoldProfit: 2938%
TNET(Telenet): EMA-Buy=12, SMA-Buy=45, Strength-Buy=27, EMA-Sell=19, SMA-Sell=45, Strength-Sell=70, Stop#ATR=14
NetProfit: 129%, #Trade

SB_Elder Impulse SystemThe strategy is based on LazyBear's Elder Impulse System
Strategy(in layman terms):
Long: When the green bar in the Elder Impulse System's indicator shows up
Short: When the red bar in the Elder Impulse System's indicator shows up
Close trade/Profit booking: When the blue bar in the Elder Impulse System's indicator shows up
Original Idea:
Message in the script if you think of any modifications/ enhancements.
Donations/Tips... :) -
BTC: 1BjswGcRR6c23pka7qh5t5k56j46cuyyy2
ETH: 0x64fed71c9d6c931639c7ba4671aeb6b05e6b3781
LTC: LKT2ykQ8QSzzfTDB6Tnsf12xwYPjgq95h4

SB_CM_RSI_2_Strategy_Version 2.0(New: Profit booking present which is not present in the previous indicator)
The strategy is based on the indicator posted by @ChrisMoody "CM RSI-2 Strategy Lower Indicator" which is based on "Larry Connors RSI-2 Strategy - Lower RSI"
In this strategy, the longs are placed when a green color is encountered in the rsi in the previous candle and short when the red color is encountered in the rsi.
Although the profits are booked when the rsi crossover the 10 level mark or crossunder the 90 level mark.
Just message in the script if you have any different idea regarding this indicator.
For the original indicator you can refer to :
For Tips to continue :) -
BTC: 1BjswGcRR6c23pka7qh5t5k56j46cuyyy2
ETH: 0x64fed71c9d6c931639c7ba4671aeb6b05e6b3781
LTC: LKT2ykQ8QSzzfTDB6Tnsf12xwYPjgq95h4

SB_CM_RSI_2_Strategy_Version 1.0The strategy is based on the indicator posted by @ChrisMoody "CM RSI-2 Strategy Lower Indicator" which is based on "Larry Connors RSI-2 Strategy - Lower RSI"
In this strategy the longs are placed when a green color is encountered in the rsi and short when red color is encountered in the rsi.
Although the profits can be booked at different interval.
Just message in the script if you have any different idea regarding this indicator.
For the original indicator you can refer to :
For Tips to continue :) :
BTC: 1BjswGcRR6c23pka7qh5t5k56j46cuyyy2
ETH: 0x64fed71c9d6c931639c7ba4671aeb6b05e6b3781
LTC: LKT2ykQ8QSzzfTDB6Tnsf12xwYPjgq95h4
